Investigating fraud requires analyzing mountains of data to detect patterns, links and connections between the data and criminal activity.
This calls for two crucial steps which ScanWriter accomplishes quickly and efficiently: data preparation and visualization.
As a data preparation tool, ScanWriter is unparalleled. It captures any document or digital file and converts it to normalized data in Excel, where an investigator can organize the information according to customized columns and fields.
An Excel spreadsheet is the first step. The second step is data analytics. For this, ScanWriter is bundled with Microsoft’s powerful visualization tool, Power BI, to create one seamless solution for your fraud case analysis needs.
Power BI’s visual representations enable the examiner to identify relationships and detect suspicious patterns that can hide in an abundance of data.
And it does this in record time.
Once the data has been captured and checked for accuracy and completeness, Power BI swiftly goes to work making connections and delivering insights that an Excel spreadsheet keeps under its hat.
Data Visualizations at Work for Fraud Investigations
Depending on your investigation strategy, ScanWriter can help you focus on the aspects of the case you want to explore.
These dynamic and interactive reports are tightly integrated with Excel and Power BI to produce on-demand, customized data visualizations.
Here are 20 ways to use ScanWriter’s robust data visualization feature to help you explore and display visually immersive and interactive insights that can help you solve, present and win cases.
- Search by name – ScanWriter allows you to trace all the activities of one or more people. By connecting these with other players and activities, you can begin to get a picture of how each role fits into the flow.
- Search by transaction type – ScanWriter makes it possible to track all activities from separate money sources such as wire transfers, PayPal, or credit cards. Isolating exchanges in this way allows the investigator to discover preferred methods and types of money transfers.
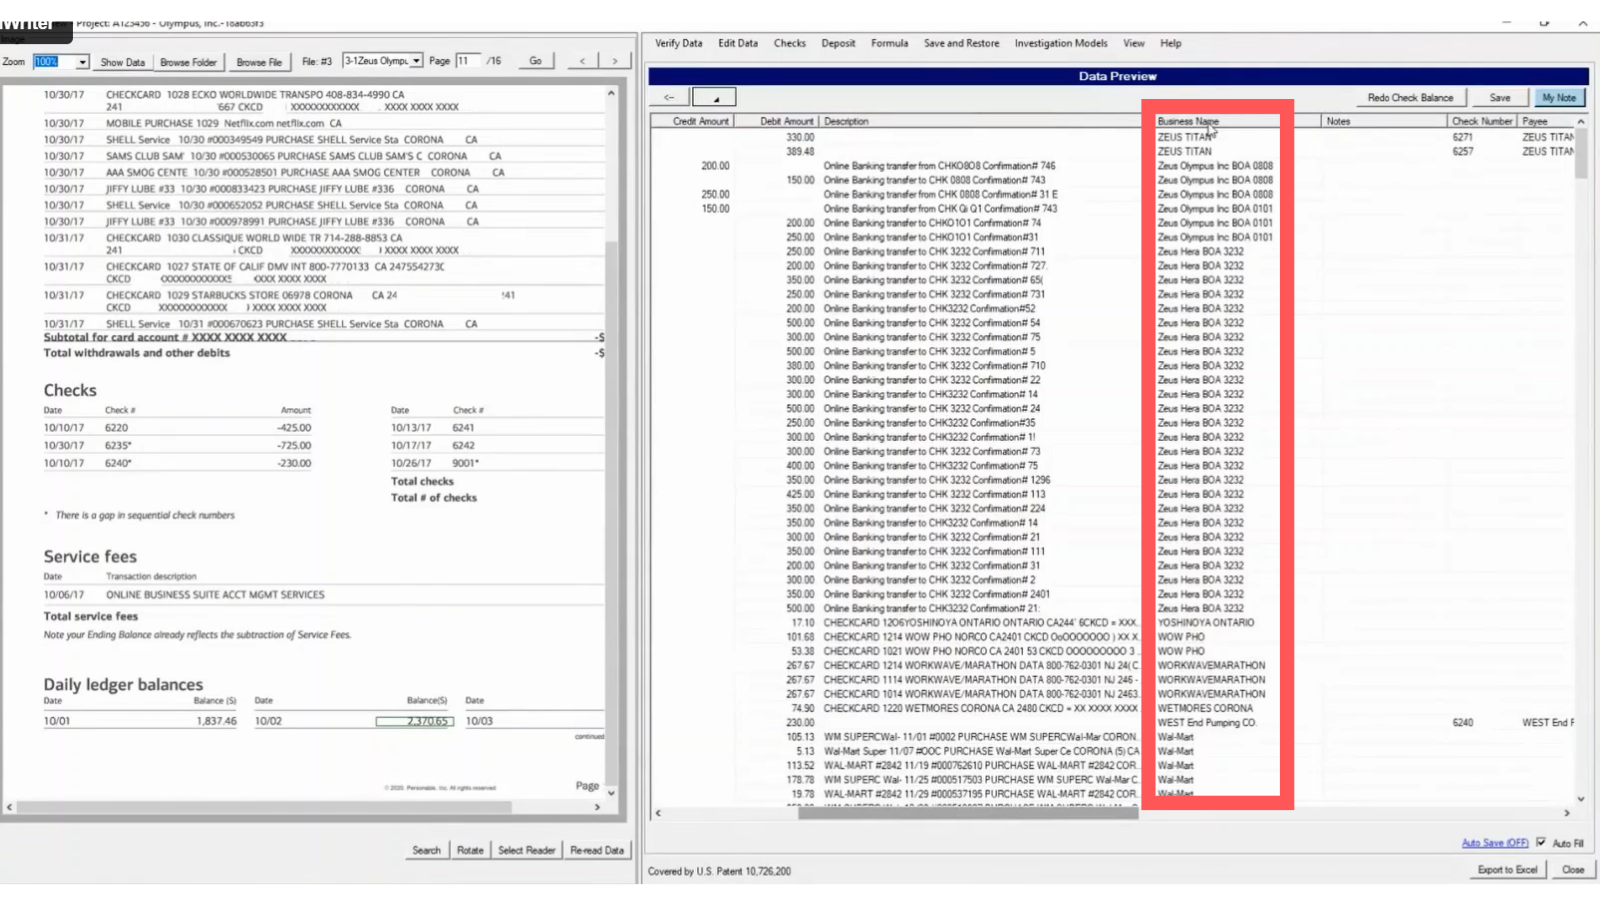
Organizing transactions based on business name (Source: ScanWriter Software)
- Search by date range – When was the money moved? How much was moved? Searching by date provides essential clues that can be connected to other events and activities.
- Activities by location – This visualization provides a map of where the transactions are taking place and their amounts. Zoom out to get a bird’s eye view of where most of the activity is occurring. Zoom in to pinpoint cities or neighborhoods with the most activity.

Visualize activities on a map (Source: ScanWriter Software)
- Relationships between accounts – ScanWriter can automatically link accounts from different banks to identify any and all deposit and withdrawal activity and make connections between account holders.
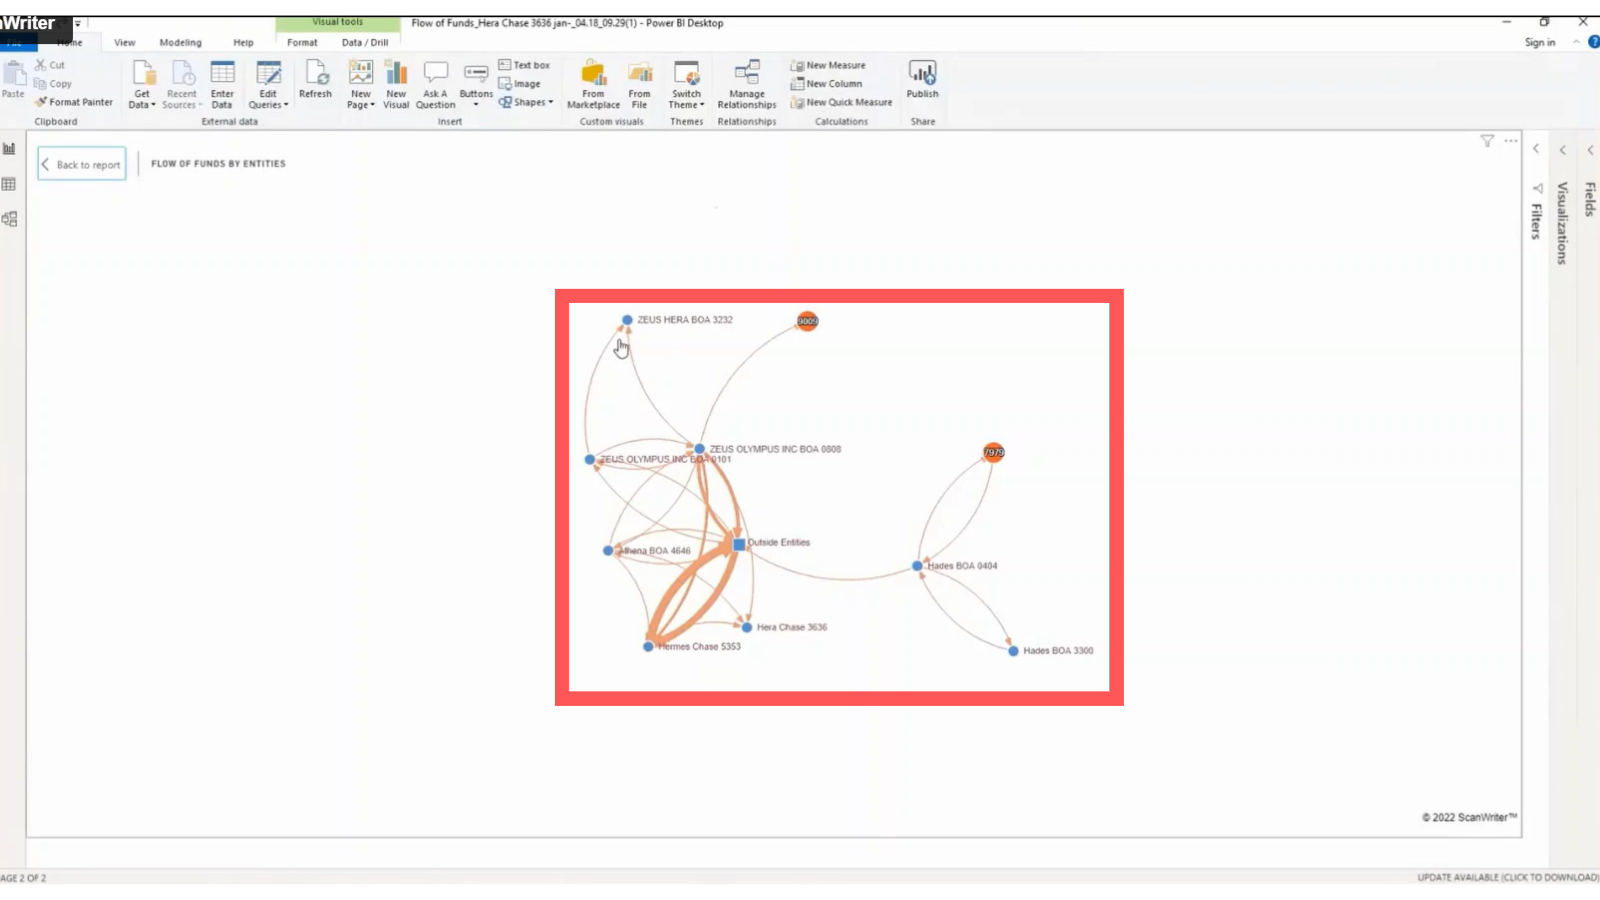
Understand the direction and exchange volume between accounts (Source: ScanWriter Software)
- Follow asset movement – Assets such as cash, property, purchases, and more can be isolated to detect possible patterns and connections.
- Bar graphs – Use ScanWriter bar graphs to visualize transaction types, entity categories, or players to analyze where there’s the most significant movement.

Bar graphs help better visualize transaction types (Source: ScanWriter Software)
- Search by amount – Not all activities are worth pursuing. With ScanWriter, you can focus on possible red flags based on transaction amounts.

A quick hover shows the transaction amount between accounts (Source: ScanWriter Software)
- Ask questions – From generic questions to very detailed ones, ScanWriter will tell you what you need to know. “What is the largest transaction amount?” When was the latest withdrawal over $10K?” Ask it any question, and ScanWriter will display the information you’re after.
- Pick your presentation tool – You can share ScanWriter’s visualizations in any number of ways. Print it out on a PDF or turn it into a PowerPoint presentation. You can present ScanWriter’s findings in a way that suits any venue or stakeholder.
- Search keywords – Any aspect of the case you wish to explore is easily accessible with ScanWriter’s search tool. Search a location, bills, payments, or a person, and you’ll see history and patterns that will help you gain insights and recognize connections.
- Adapt to new information – Because new material is constantly added to cases, ScanWriter updates its reports iteratively and thoroughly.
- Produce concise reports – You decide the information you want to see. Every report you create is custom-made to your specifications and investigation needs.

Create investigation-specific reports for a quick turnaround (Source: ScanWriter Software)
- Drill down to details – Every report provides an overview of the activity and the ability to drill down to more detailed descriptions of a particular transaction.
- Use anytime, anywhere – Whether users are online or offline, ScanWriter is always available on a browser or your devices when you’re on the go.
- Review source documents – While ScanWriter provides at-a-glance views of key indicators, source documents are always just a click away.
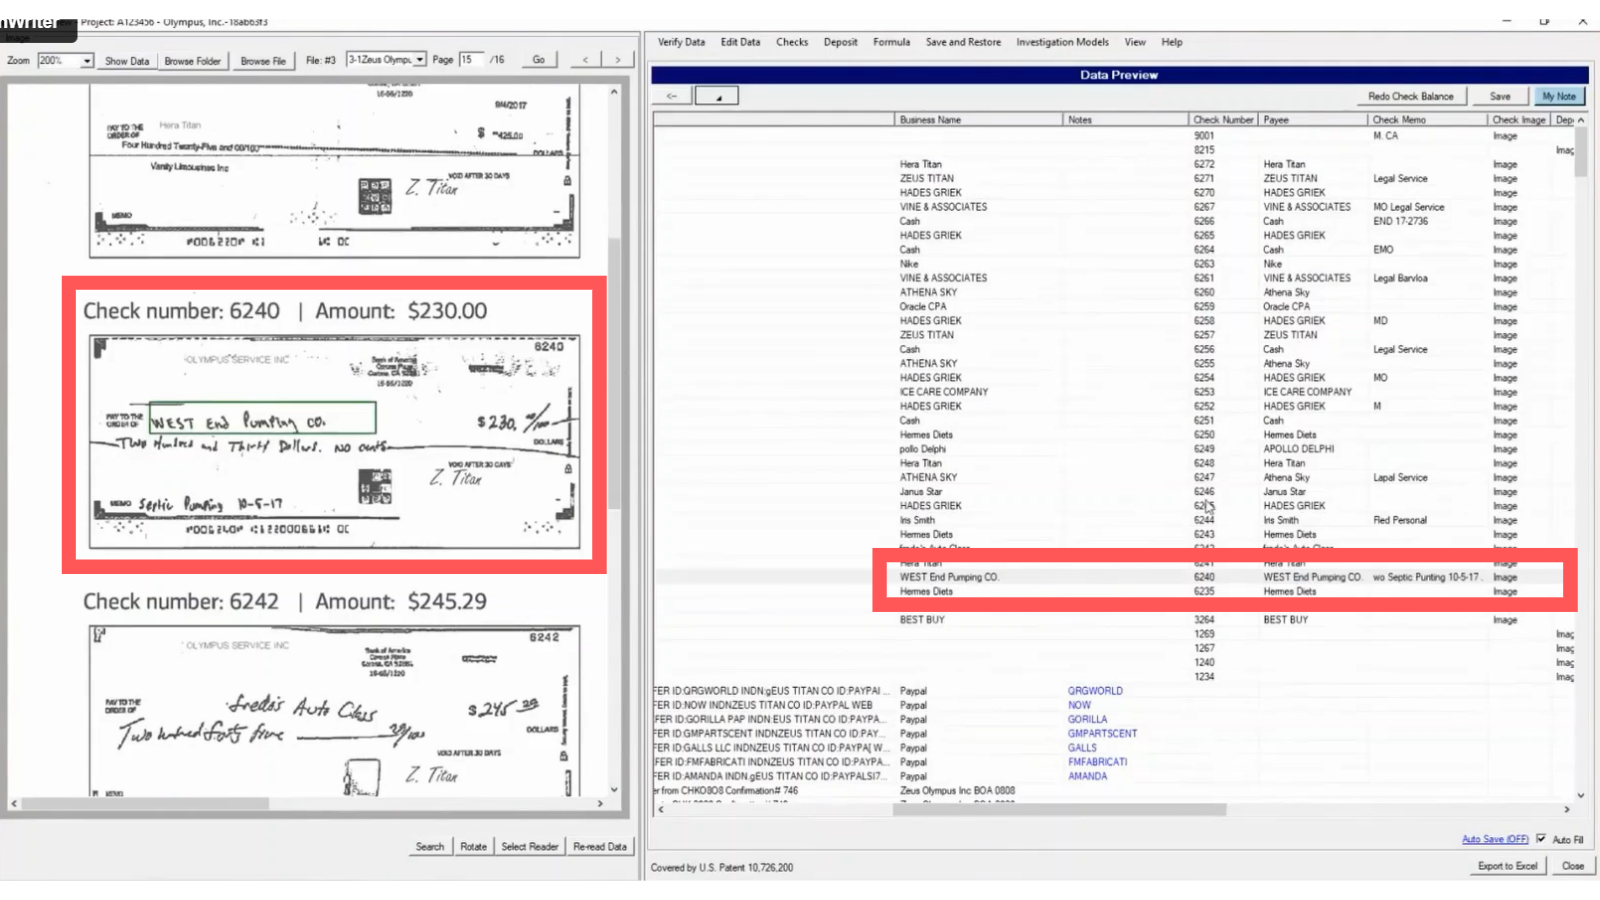
Instantly verify information from source documents (Source: ScanWriter Software)
- Formulate strategic decisions – ScanWriter makes it easy to interpret big data and implement effective strategies based on discoveries and insights.
- Generate reports with one click – ScanWriter requires no tech background. Anyone can quickly turn their data into live interactive visuals.
- Share with stakeholders – ScanWriter makes collaboration simple. Share reports, dashboards, and visualizations quickly and securely with team members and stakeholders.
- Prepare compelling case narratives – The goal of your investigation is to prepare the evidence that will help you identify criminal activity. Data visualization models like “flow of funds” can help investigators get visual confirmation of trends and outliers that can characterize fraud. Use ScanWriter to create interactive or dynamic exhibits for jurors and judges that highlight fraudulent activity and withstand cross-examination.
Also read: Asset Tracing: How Technology Can Help Fraud Investigators Follow The Money To Trace Assets?
Parting Thoughts
Regardless of the fraud case you’re investigating, the data analytic features of ScanWriter can help you detect fraudulent activities by uncovering and connecting events, entities, and the flow of money.
Use ScanWriter to capture information and transform any amount of data into dynamic visualizations that help you solve cases by connecting assets, entities, and transaction activities.
Try It Yourself
See how ScanWriter can help you gain insights and save precious time.
Our 14-day pilot program allows you to use ScanWriter’s various analytical models to explore data, interact with reports and gain insights that can help you make critical discoveries and build strong cases.
Empower your investigation with the number one name in financial fraud investigation software — ScanWriter.
Sign up for a free trial here.