“Human brains are wired to process visual information faster than text. Automated data visualization makes it easy to comprehend complex financial information in a fraction of the time taken manually.” — Benjamin Chou, Founder of Personable Inc.
They say that a picture is worth a thousand words. Financial fraud investigations require the preparation and analysis of complex financial data from numerous sources. To convert this data into an understandable format, you must be spending hours and a great deal of effort. On the other hand, data visualization depicts enormous and scattered financial data simply and insightfully.
In this day and age of Artificial Intelligence and fast-paced technology, it is possible to automate your data preparation, analysis, and visualization. Therefore, instead of manually preparing financial data visualizations, focus your energies on the investigation. Choose a data visualization software that extracts the pertinent facts and provides a granular analysis in charts, graphs, and other financial models like ‘follow the money’. Some of the features to look for in data visualization software:
- Processes any kind of financial documents, including handwritten checks
- Automatic creation of insightful reports and dashboards
- Accuracy in processing data into Excel or visual representations
- Quickly analyzes data trends
- Seamless integration with existing applications
- Easy to use interface and secure sharing of data
Now here are seven financial data visualization software for financial fraud investigation to consider:
- ScanWriter
- Chorus Financial
- Comprehensive Financial Investigative Solution (CFIS)
- Valid8
- Verafin
- Yellowfinbi
- BusinessOptix
#1. ScanWriter
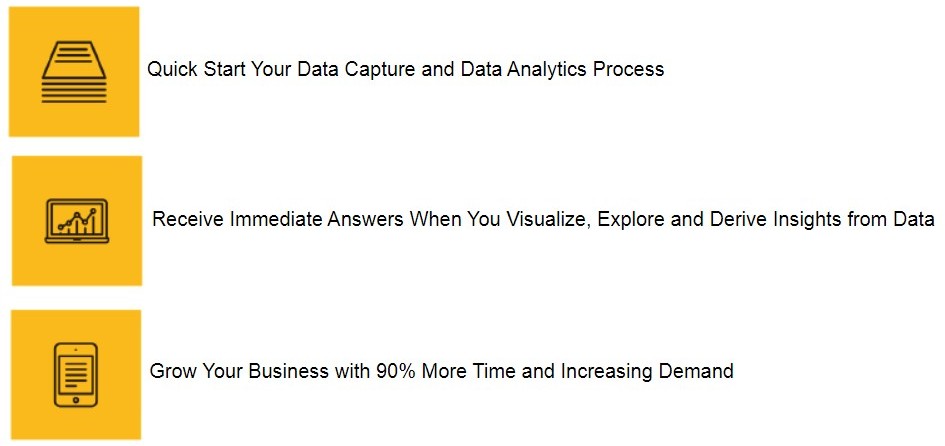
ScanWriter by Personable Inc. is a certified partner of Microsoft’s Power BI (Business Intelligence). It provides a single solution approach to data analytics and deeper business intelligence by leveraging the power of automated data capture and data visualization. ScanWriter’s data entry automation feature can convert any paper document or digital file into structured and normalized data on Excel and data visualization – like financial models. It also provides an analytic summary within minutes.
Key Benefits
- Streamlines data entry for bank statements, bills, invoices, receipts, check images, phone records, insurance forms, and other such documents into Excel or data visualization
- Creates reports and provides access to the dashboard without any hassle
- Reads your financial documents quickly & efficiently
- Instantly cuts hourly labor costs by 90%
- Links Excel cells to data sources and highlights the data origin location
- In-house security and privacy amongst financial documentation
- Reduces the need for multiple checkpoints to account for human error
- Manages high volume & batch processing
- User-friendly editing and review screens
- Automated account coding & entity name recognition
- Provides continuous support to ensure smooth functioning of the software
Source: Personable Inc
Ability to Populate Financial Models
ScanWriter converts any paper or PDF document into Excel, structuring and transforming data into the correct format every time with 100% accuracy. As a result, data doesn’t need adjusting, and files are quickly ready for analysis and reporting. Then Power BI turns data into easy-to-understand valuable case information.
ScanWriter automatically creates financial data visualizations like ‘flow of funds’ and segregates the financial data based on the following factors for an efficient analysis:
- The flow of funds with pictures
- Activities by location
- The flow of funds by the entity
- The flow of funds by amount and date
- The flow of funds by category
ScanWriter has the option to automatically populate your financial data in one of the well-known financial models that are integrated within the software. So you don’t need to add the data manually or start from scratch.
Ease/Difficulty of Preparing Data Visualizations
ScanWriter uses Microsoft Power BI for interactive data visualization by running accepted models for bank statements, including the flow of funds by account, transactions, expenses, incoming funds, and transaction locations.
Here’s an example of how the visual representation of the flow of funds by account looks like:
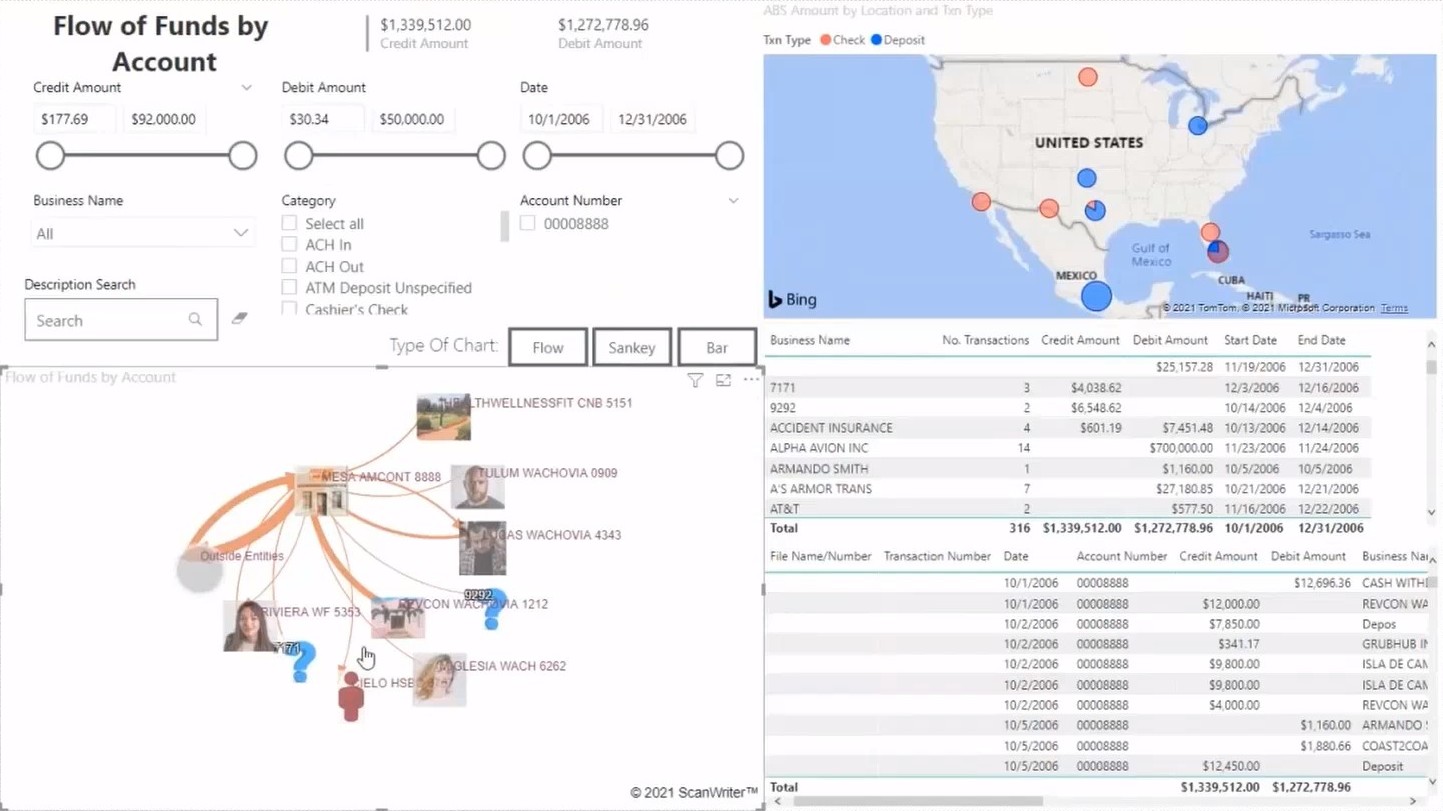
Source: Personable Inc
Integration & Deployment
ScanWriter integrates seamlessly with Excel and Microsoft Power BI. It is deployable on cloud, SaaS, web-based, on-premise – Windows, on-premise – Linux.
Financial Institutions Support
ScanWriter supports more than 40,000 institutions, including more than 10,000 financial institutions. Personable also provides customization of a format for your document within 24 to 48 hours of your request.
Language Support
It supports 21 languages, including most European, Asian, Middle Eastern languages.
Location
Personable has its corporate office in California, with another office in Washington DC.
Client Base
ScanWriter has a client base consisting of both the government and private entities.
Customer Feedback
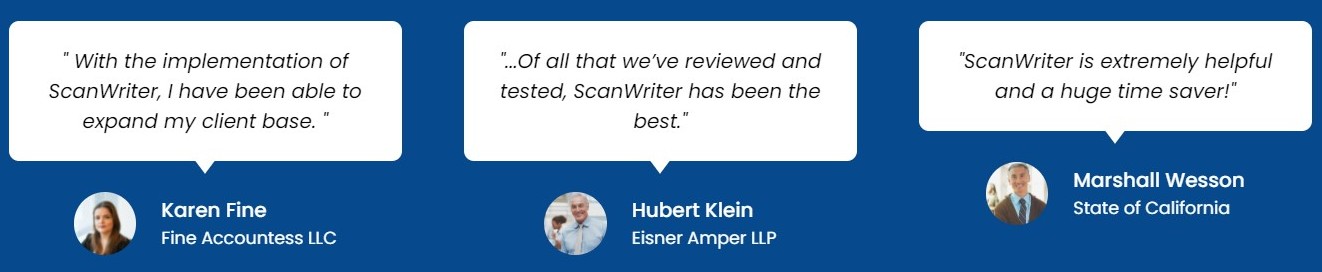
Source: Personable Inc
Pricing
Standard ScanWriter Excel costs $4995 per license, including one workstation user and ten customized readers. In addition, a non-prorated $2940 annual maintenance fee is applicable.
You can reach out to the company for prices on the Premier ScanWriter Excel, which includes standard features plus an independent library.
#2. Chorus Financial
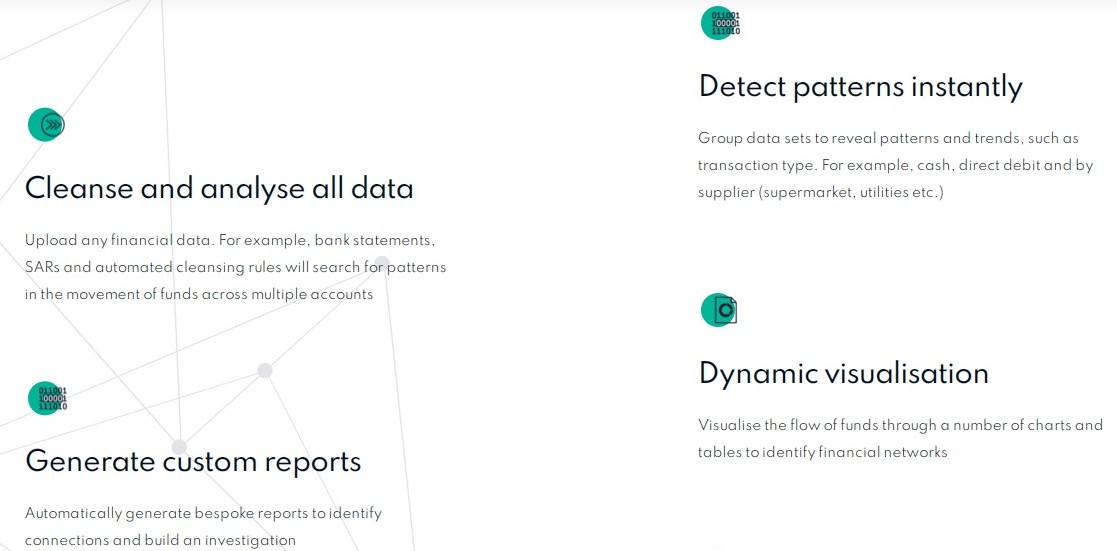
Chorus Financial by Chorus Intelligence Inc is a financial investigation software that reduces the time spent processing bank statements and other financial documents. It helps to efficiently input data, analyze, and report on illegal activities. In addition, the automated cleansing rules search for patterns in the movement of funds across multiple accounts, reducing the risk of financial fraud.
Key Benefits
- Cleans and analyzes all kinds of data
- Finds the flow of funds moving through multiple accounts
- Uses reports and other visualizations to link transactions and identify financial indicators of fraud and money laundering
- Automatically generates bespoke reports to identify connections and build an investigation
- Saves time and maximizes efficiency
- Reduces operational risk through enhanced analytical modeling techniques
- Automatically adds extra information to transactions to help build up a profile and identify a financial lifestyle
Source: Chorus Intelligence Inc
Ability to Populate Financial Models
Chorus Financial allows you to automatically load financial data with the help of an easy-to-use drag and drop tool. It enhances the data immediately and codes all transactions. It also shows how the account is functioning with the help of a summary table.
Ease/Difficulty of Preparing Data Visualizations
It creates dynamic visualization of the flow of funds through several charts and tables to identify financial networks.
Integration & Deployment
Chorus Financial deploys as standalone, on-premise, private cloud, and Azure public cloud.
Language Support
English.
Location
Chorus Intelligence Inc has its headquarter in the United Kingdom with an office in Virginia, USA.
Client Base
Chorus Financial’s client base mainly consists of police, governments, and broader law enforcement agencies investigating economic and financial crime.
Customer Feedback
Source: Chorus Intelligence Inc
Pricing
The single license fee includes training, support, and upgrades. The price per user for a software license is £10,000, and cloud hosting is £500.
#3. Comprehensive Financial Investigative Solution (CFIS)
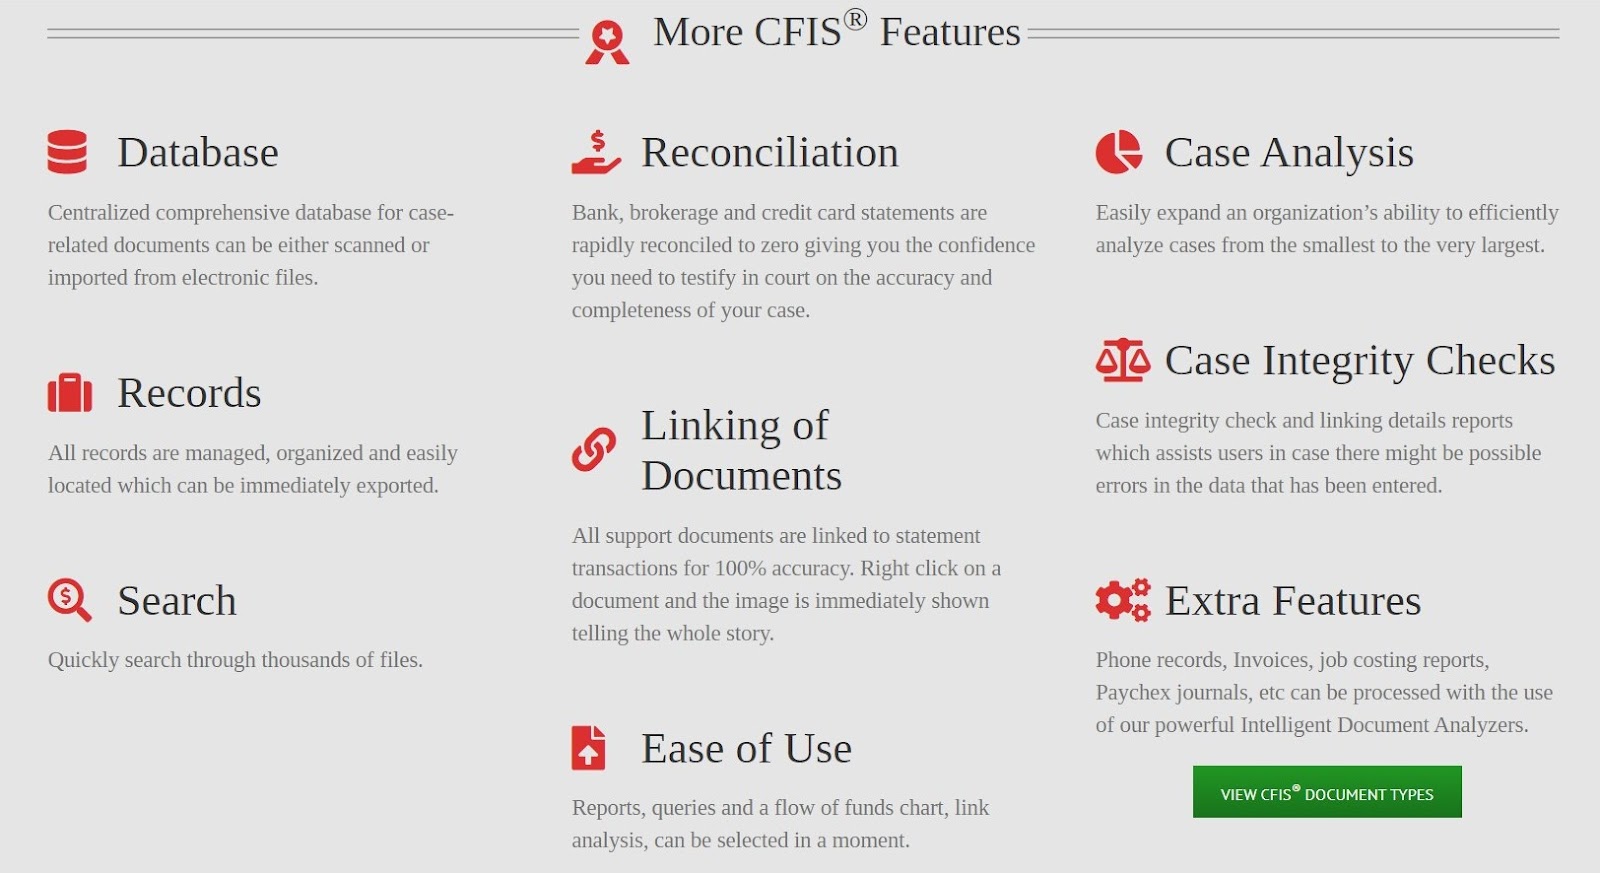
Comprehensive Financial Investigative Solution (CFIS) by Actionable Intelligence Technologies, Inc. (AIT) processes bank, brokerage, and credit card statements, supporting multiple languages and currencies. Once reconciled to zero, it can run reports and link the support documents, i.e., wires, checks, deposit tickets, receipts, etc., to statement transactions showing the flow of funds. In addition, it can process all kinds of data with speed and accuracy.
Key Benefits
- Performs rapid assembly and data capture of voluminous financial records
- Automates the analysis of complex investigations for a full range of illicit financial schemes and frauds
- Provides an unprecedented increase in productivity
- Reads all wire formats, MICR line of checks, & typed and printed checks
- Automatically process paper and electronic financial documents and record data into a centralized, comprehensive database
Source: AIT
Ability to Populate Financial Models
CFIS processes and reconciles bank, brokerage, and credit card statements to zero and records data into a centralized, comprehensive database. Queries and reports can be filtered in myriad ways, instantly providing intelligence to move, seize assets, and follow the whole scheme.
Ease/Difficulty of Preparing Data Visualizations
CFIS provides comprehensive data analysis, graphic visualization of transactional financial patterns, the flow of funds tracing and analysis, and a full range of reporting capabilities.
Integration & Deployment
You can deploy the licensed software in a virtual software environment, e.g., VMware, Inc. products, Microsoft® Hyper-V, Microsoft® Virtual PC, Citrix® XenApp, etc., and a physical licensing device, e.g., licensing appliance or hardware dongle.
Financial Institutions Support
IDA Library – over 11,500 formats.
Language Support
CFIS supports multiple languages.
Location
Actionable Intelligence Technologies, Inc. is located in Virginia, United States, and provides global services.
Client Base
Federal, State & Local, Prosecutors, Law Enforcement, Regulatory Agencies, and Forensic Accountants form the primary client base for CFIS. In addition, it also has a few commercial clients.
Pricing
The current price list for CFIS, its maintenance, and the related fee is available here.
#4. Valid8
Valid8 provides automated reconciliation of financial data to visualize missing, duplicate, and incorrect data. In addition, it creates a living database of transactions.
Key Benefits
- Allows adding transactions from new accounts, appending check and depositing slip data, grouping and categorizing transactions with ease as the body of evidence grows
- Transforms native or non-native PDF statements from any institution in any format into a database of evidence
- Monitors progress of your data set in real-time
- Identifies any wires or transfers to undisclosed accounts quickly
- Filters and examines transfers to determine fraudulent transfers and preference payments
- Provides one-click export of the entire transaction database to Microsoft Excel
Ability to Populate Financial Models
Valid8 creates a living database of transactions. As your body of evidence grows, you can add transactions from new accounts, append checks and deposit slip data, group and categorize transactions easily.
Ease/Difficulty of Preparing Data Visualizations
Valid8’s transfer matching algorithms and interactive data visualizations automate tracing the flow of funds.
Integration & Deployment
Amazon Web Services can host that Valid8 application and data.
Language Support
English.
Location
Valid8 Financial, Inc. has two offices in Washington and Colorado in the United States.
Client Base
Valid8 caters to federal and state government agencies in the United States and private clients, including auditors, forensic accountants, expert witnesses, chapter 11 trustees, etc.
Customer Feedback
Watch this video to know what the customers of Valid8 have to say about the software.
Pricing
Pricing is available upon request from the company.
#5. Verafin
Verafin’s cloud-based, consolidated financial crime management platform provides financial institutions with a complete solution to detect, investigate and report financial crime. It applies cross-institutional analysis and machine learning technology to analyze billions of transactions. In addition, Verafin provides innovative evidence and investigation tools, such as risk-rated evidence, check image viewer, balance charts, geographic maps, and interactive relationship graphs.
Key Benefits
- Reduces false positives significantly during the investigation process
- Imports and analyzes an immense amount of information from multiple sources, including core system, ancillary source, open-source, third-party, and consortium data
- Creates detailed reports with Verafin’s unique visual storytelling capabilities
- Provides a secure environment
- Lets you create a fully audited and tracked investigation
Ability to Populate Financial Models
With hundreds of ad-hoc data reports, and the ability to create custom reports that include the information fields you need, Verafin helps improve auditing, reporting, and record-keeping of all aspects of your fraud and AML detection efforts.
Ease/Difficulty of Preparing Data Visualizations
Verafin streamlines the investigation process by significantly reducing false positives and delivering insights through enhanced data analysis and innovative visualization tools. You can get risk-rated evidence, check image viewer, balance charts, geographic maps, and interactive relationship graphs with competent evidence and investigation tools.
Integration & Deployment
Verafin is deployable on cloud, SaaS, web-based.
Financial Institutions Support
Supports numerous financial institutions and uses artificial intelligence and machine learning for cross-institutional, multi-channel analysis.
Language Support
English.
Location
Verafin Inc. has its headquarters in Newfoundland, Canada.
Client Base
The target customer market of Verafin includes financial institutions, credit unions, and private organizations involved in economic investigation.
Customer Feedback
Source: Verafin Inc.
Pricing
Pricing is available upon request from the company.
#6. Yellowfin Analytics Suite
Yellowfin Analytics Suite is an analytics software with self-service Business Intelligence (BI) and dashboards providing data visualization, automated business monitoring, and data preparation. It simplifies the entire analytics workflow and automates critical parts of the analysis process, ensuring timeliness, accuracy, and reliability.
Key Benefits
- Extends your dashboards with operational workflows and operationalizes your data science models so end users can take action right within your dashboard
- Enables you to create data sets that are governed and secure
- Automates the data discovery process
- Provides data storytelling and collaboration
- Includes comprehensive data exploration and visualization tools
Ability to Populate Financial Models
Yellowfin Analytics Suite automatically monitors your data to know any changes in the business data. It also creates management reports directly.
Ease/Difficulty of Preparing Data Visualizations
Yellowfin enables you to create stunning visualizations that help to build compelling dashboards, data stories, and presentations. The visualizations allow everyone to see and understand trends, outliers, and patterns in the data.
Integration & Deployment
You can host Yellowfin Analytics Suite on public clouds like AWS, Azure, and GCP, as well as private or hybrid cloud environments. It also has a mobile application. In addition, you can easily embed Yellowfin into your applications and use data to drive action.
Language Support
English.
Location
With its headquarters in Melbourne, Australia, Yellowfin has offices worldwide, including Japan, North America, South America, Europe & South Africa.
Client Base
Yellowfin primarily caters to the private sector, including data analysts and more than 29,000 companies worldwide.
Customer Feedback

Source: g2
Pricing
Pricing is available on request from the company as per your requirements.
#7. BusinessOptix
BusinessOptix is a cloud-based platform that captures and redefines business operating models and streamlines go-to-market processes. It provides a single cloud-based enterprise-scale platform that meets their end-to-end needs for collaboration and a central repository.
Key Benefits
- Customizable and designed to adapt to your unique needs
- Includes training and support to get started and develop users skills and knowledge
- Allows creation and sharing of content with your teams effortlessly
- Analysis tools help you evaluate progress to date and forecast timelines and expected outcomes
- Delivers results and sizeable returns on investment
- Leverages your unique data set by creating custom reports
- Visualizes and connects people, processes, and systems vertically or horizontally across all areas
Ability to Populate Financial Models
BusinessOptix process mining capabilities provide a data-driven, fact-based approach to process improvement, leveraging empirical evidence to uncover how your processes work.
Ease/Difficulty of Preparing Data Visualizations
BusinessOptix provides a mix of out-of-the-box and configurable reports and dashboards that enable you to track initiative progress. These reports include details of milestones and the current rate of progress, prioritized workstreams and work items (each with a target for completion and the actual progress to date), and resource utilization and performance.
Integration & Deployment
It is deployable on Cloud, SaaS, Web-Based, on-premise-Windows, and Linux.
Financial Institutions Support
BusinessOptix supports multiple banks and financial institutions.
Language Support
English.
Location
BusinessOptix has its headquarters in Kansas, USA, and another office in the UK.
Client Base
BusinessOptix’s client base consists of local and central government and private organizations in banking, financial, construction, healthcare, retail, and other sectors.
Customer Feedback
Source: BusinessOptix
Pricing
BusinessOptix provides a free trial. You may contact the company for pricing.
Takeaway
Manual interpretation of data from multiple sources is daunting, but you can automatically convert complex data into smaller chunks and static figures for quick analysis and outcomes. Since the visual representation of data is easy to consume and understand, you should opt for data visualization software. Ben A. Shneiderman rightly said that ‘the purpose of visualization is insight, not pictures.’. To get accurate, insightful, and automated data visualization, choose from one of the tools above.
Get rid of manual labor needed to create financial data visualizations manually in Excel. Schedule a free online demo with ScanWriter now to learn about automated financial data visualization solutions.