If you’re a fraud examiner in 2024 based in the USA, your work is cut out for you. You’re tasked with analyzing thousands of datasets to identify the perpetrators in what the papers call an “epic swindle” (aka fraud) of COVID-19 relief funds by individuals, businesses, and even organized crime syndicates.
You’re using your tried and true tactics to carry out your work. For example, you might use Excel to detect unusual trends, comparing transaction dates with individual patterns to look for fraudulent activity.
You might even use Benford’s Law — a common tactic in fraud investigations to discover ingenuine data reporting. To use it, most fraud examiners plug complex calculations into Excel to assess thousands of datasets.
But despite Excel’s functionality, assessing Benford’s Law is time-consuming and tedious.
You’re overworked and frustrated. But, most importantly, you want to speed up the process of recovering billions stolen through COVID relief fraud.
ScanWriter’s made-for-purpose software can help you assess Benford’s Law quickly and seamlessly in a single click.
The result? Fraud examiners can weigh datasets against Benford’s Law in seconds — no more spending precious time and energy with complex Excel calculations.
Today, we’ll explore:
- Benford’s Law and how to use it in Excel
- How Benford’s Law supports fraud investigations
- How to use Benford’s Law in seconds with ScanWriter
Benford’s Law | Microsoft Excel v. ScanWriter
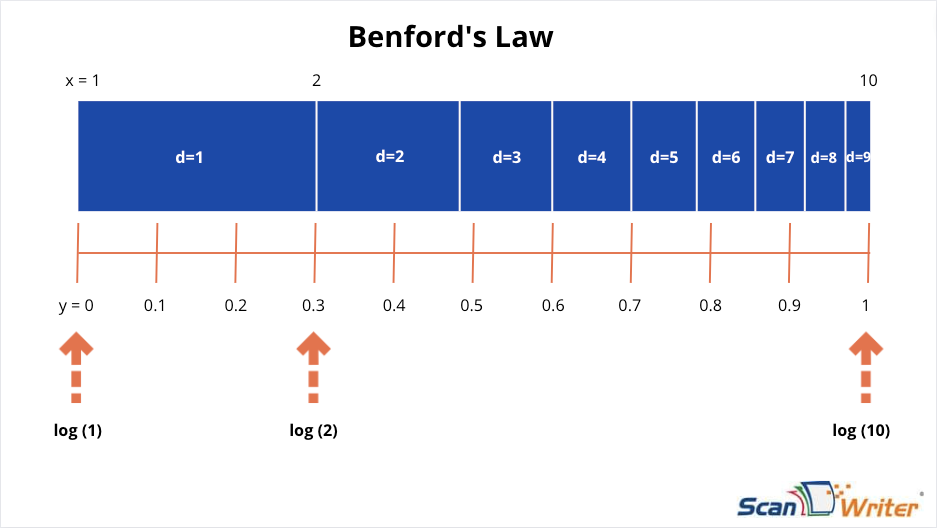
Benford’s Law is a mathematical principle showing lower-value numbers as prevalent among first digits for various financial data points.
Think of any report with numbers. Corporation sales data? A country’s cancer-case reporting? Time and time again, large number sets reflect a distribution consistent with Benford’s Law — as long as they’re manually entered.
About 30% of the data figures will start with the digit 1. Then, 18% will start with 2, sloping downward to the smallest proportion beginning with 9.
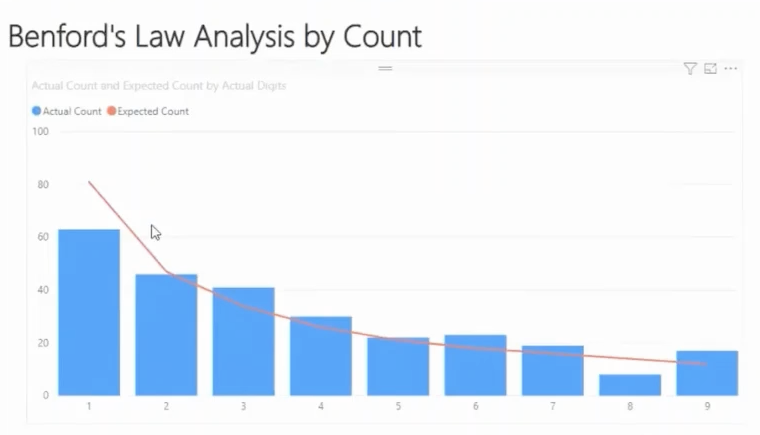
Now, you can automate a Power BI visualization chart in ScanWriter to assess Benford’s Law in financial data sets. Displayed as a line graph, the line should ideally start at the top and slope downwards as you pass through numbers 1 to 9. Any discrepancies or deviations from the Benford line indicate the numbers were manipulated by fraudsters.
The time to create one? Seconds, in ScanWriter.
Of course, you could do the same in Excel — but it’s more complex and takes a while.
Excel – The Cumbersome Way
Assessing Benford’s Law in Excel requires creating five additional columns to your data chart.
You’d start with a table of financial data. Then, you’d create a new column and title it “first digit.” Next, you’d plug in the corresponding first digit in your new column for each data point.
Now, you’ll skip a column and create a new chart with four distinct columns. Your first column will be titled “digit,” listing every digit from 1 to 9. Next, you’ll create an adjacent column and title it “frequency.” Use the COUNTIF function to determine the number of times each digit appears as a first digit in your financial data set.
A common result will be a higher frequency starting with 1, steadily decreasing.
In a third column, you’ll populate the frequency percentage. Finally, you can check for Benford’s Law. Your fourth column will be titled “Benford’s Law,” and you’ll use the following Excel formula with d as the leading digit:
=LOG10 (1+1/d)
Compare your Benford’s Law column to your frequency percentage column — are they similar? If not, you might be dealing with inaccurate reports or fraud.
Tedious, right? You’re used to it, but it doesn’t have to be this way. Let’s save time and assess Benford’s Law in ScanWriter instead!
ScanWriter – The One-Click Way
ScanWriter uses analytic models to generate data insights fast. Some analytic models include “Flow of Funds,” “Expense Analysis,” and, of course: Benford’s Law.
The Benford’s Law model is super easy to use.
You’ll see your data preview chart listing all your financial data. In the “Investigative Models” tab, click Power BI. You’ll then be prompted to select a Power BI model — click “Benford’s Law.” Then, hit “Export and Run Power BI.”
No calculations, no stress. Just wait a few moments, and as the Power BI automates.
Voila — you’ll see a line graph with Benford’s Law (expected values) traveling down the chart in contrast with your financial data’s frequency count. If your data deviates from the Benford line, you’ll have reason to investigate potentially manipulated data.
Source – ScanWriter Software
All the attributions and descriptive data are listed below the graph for easy reviewing.
As you can see, the work in applying Benford’s Law in ScanWriter is minimal.
Can Benford’s Law Help Investigate Covid Relief Fraud?
In short? Yes, but it’s more of a helpful starting point than a comprehensive solution.
A deviation from Benford’s Law is a reason for further investigation. However, it isn’t sufficient to prove fraud in court. In an article titled “Application of Benford’s Law in Data Analysis” in the UK’s IOP Journal of Physics, data expert Feifei Li and co. describe Benford’s Law as inapplicable to numbers formed by chance — like phone numbers, weight, or lottery numbers.
But COVID relief data wouldn’t always be formed by chance. If people are manually reporting false numbers, like prepayments, accruals, fund transfers, and acquisitions, Benford’s Law should catch it and present a case to investigate.
Accounting professor Mark Negrini asserts that Benford’s Law can detect false journal entries and irregularities from manual entry — aka fraud. Businesses and individuals self-reported various financial figures like internal billings, void transactions, and more on applications for COVID-19 relief. If fraudulent, Benford’s Law will reveal discrepancies.
However, Negrini does add the caveat that irregularities aren’t always fraudulent. They may indicate duplications, processing inefficiencies, or as Fi elaborates, system errors, misinterpretations, or even an inefficient data scope.
Moreover, Negrini asserts that automated journal entries triggered by day-to-day business activities won’t always reflect Benford’s Law. For example, a lawyer’s retainer fee might appear as $5,000 for every case, altering Benford’s distribution principle.
A Quick Wrap Up
Bottom line? Benford’s law peels back the curtain on financial patterns you may have never noticed.
As a fraud examiner, you can take a call to conduct further investigation to substantiate your flag from Benford’s Law.
And ScanWriter gets you to that point a lot faster than Excel with automated Power BI visualizations. But Benford’s Law is the tip of the iceberg. ScanWriter has plenty of analytic models to improve efficiency in your fraud investigations. For example, our automated visualizations of flow of funds model is a game changer for tracing assets.
Ready to breeze through your COVID relief fraud investigation with 100% accuracy and top-of-the-line forensic accounting tools? Don’t take our word for it — see for yourself and try ScanWriter’s 14-day free pilot.